Back


11 Oct 2019
GBP/USD technical analysis: Largest two-day advance since 2016 on Brexit optimism, off 1.2700 handle
- EU27 tunnel negotiations with the United Kingdom sparks 200-pip spike on Cable.
- In the New York session, GBP/USD is easing from the 1.2700 handle.
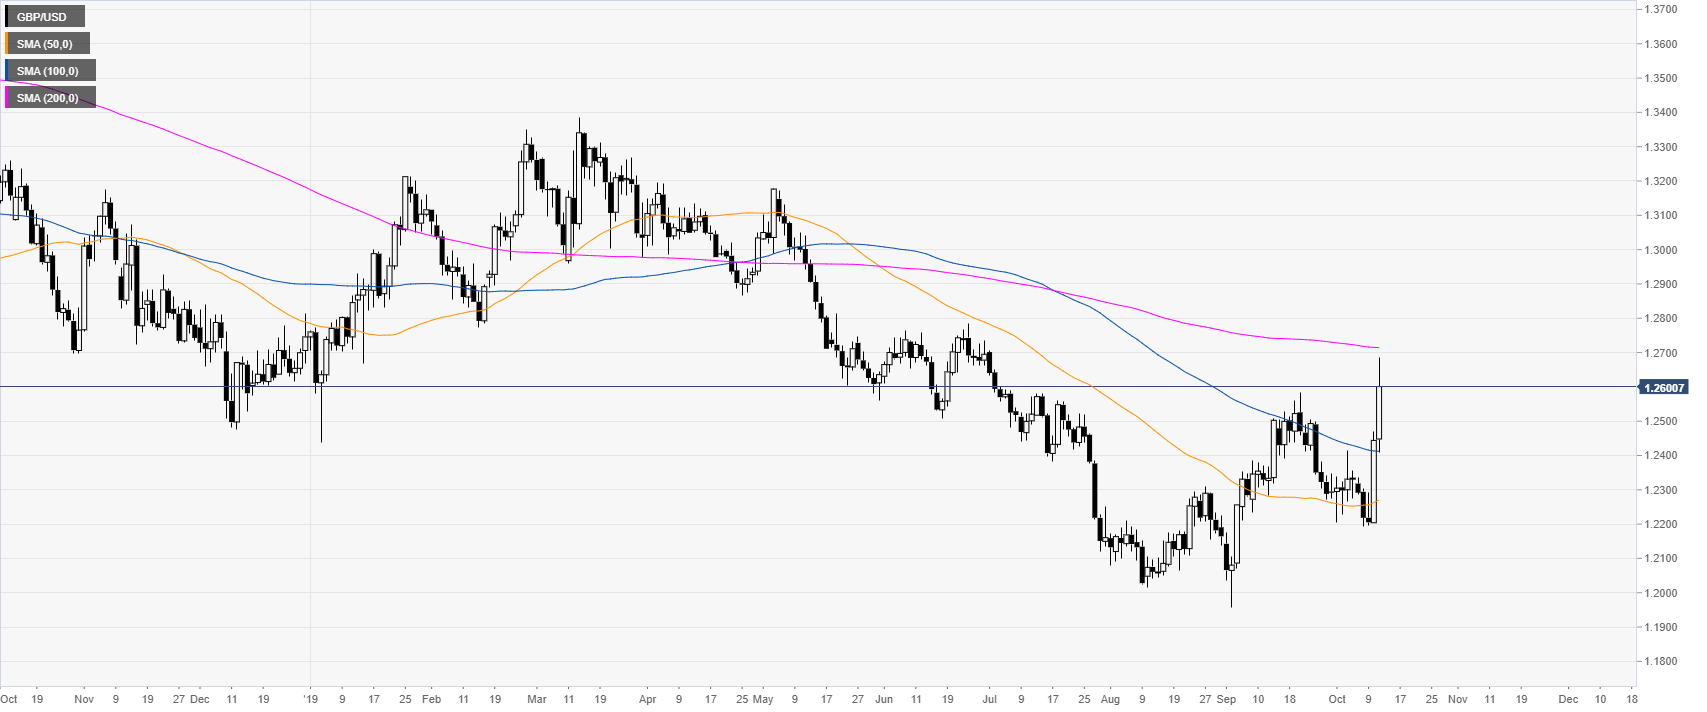
GBP/USD daily chart
The Cable, on the daily chart, is trading in a bear trend below its 200-day simple moving average (DSMA). GBP/USD is up nearly 500 pips from the October lows, as the Cable is on track to its largest two-day rally since 2016. The last leg up is attributed to EU’s Chief Brexit Negotiator Barnier having the green light from the EU27 for tunnel negotiations with the United Kingdom.

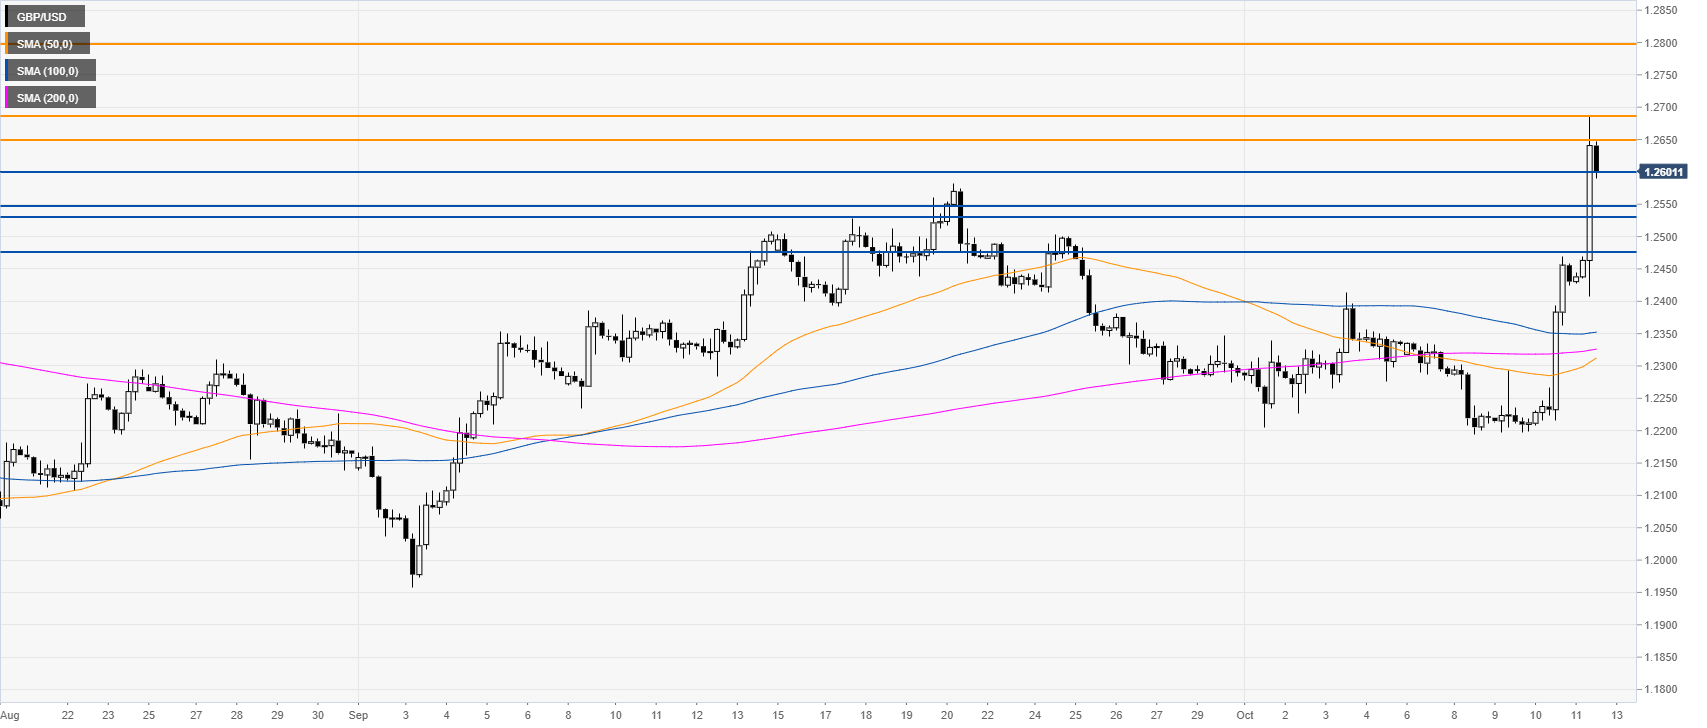
GBP/USD four-hour chart
GBP/USD got another leg up worth about 200 pips. The market is currently consolidating the spike below the 1.2700 handle. If the market break above this level the newt stop can become the 1.2800 figure.

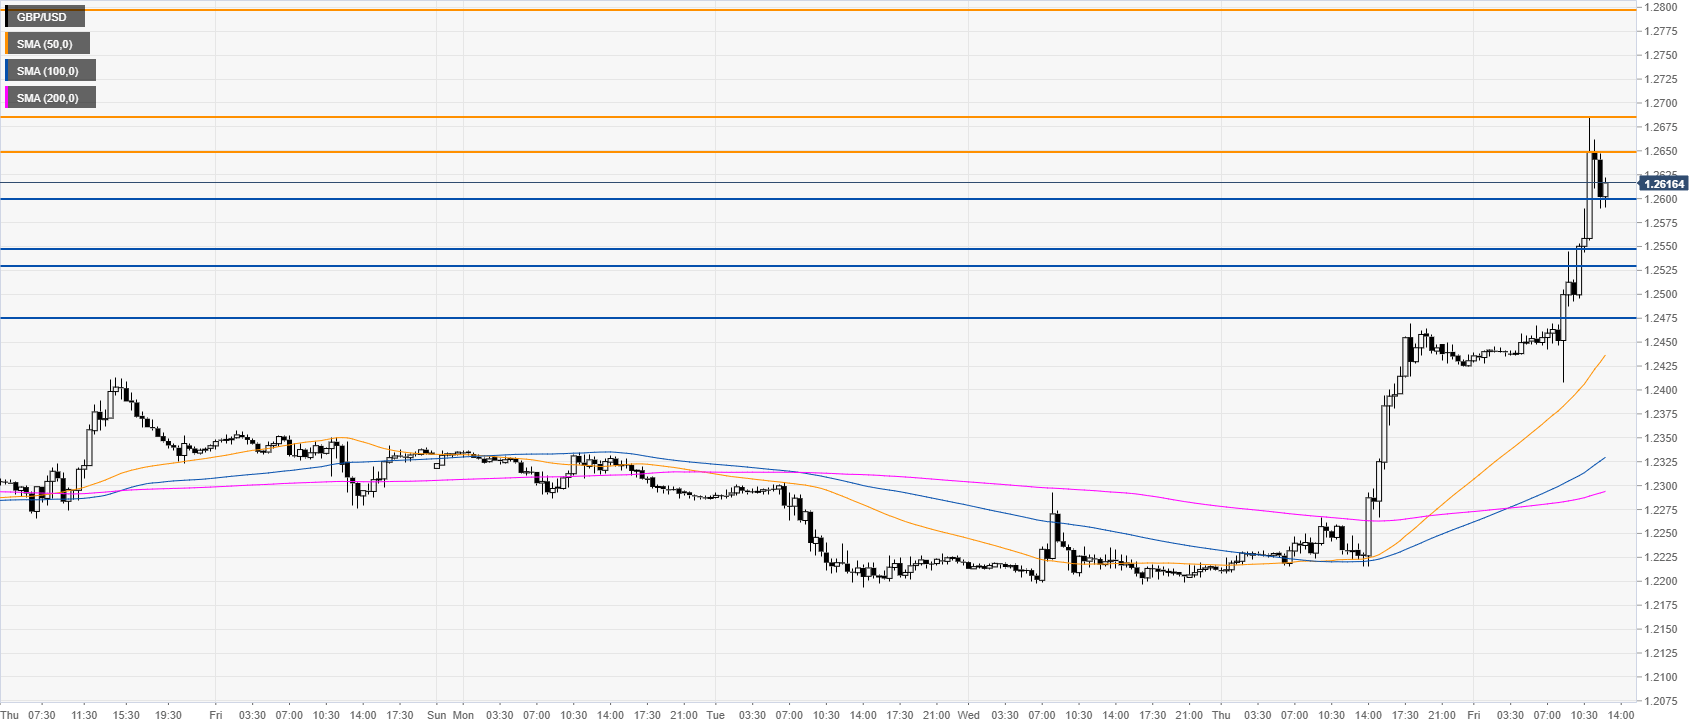
GBP/USD 30-minute chart
The Pound is trading above the main SMAs, suggesting bullish momentum in the near term. Support is seen at the 1.2600, 1.2543/30 zone and the 1.2477 level, according to the Technical Confluences Indicator.

Additional key levels
