GBP/JPY Price Analysis: Bulls and bears jostle inside symmetrical triangle
- GBP/JPY remains weak below 200-hour SMA.
- 61.8% Fibonacci retracement adds to the resistance for bulls targeting the monthly top.
- Gradual grind towards November bottom can’t be ruled out.
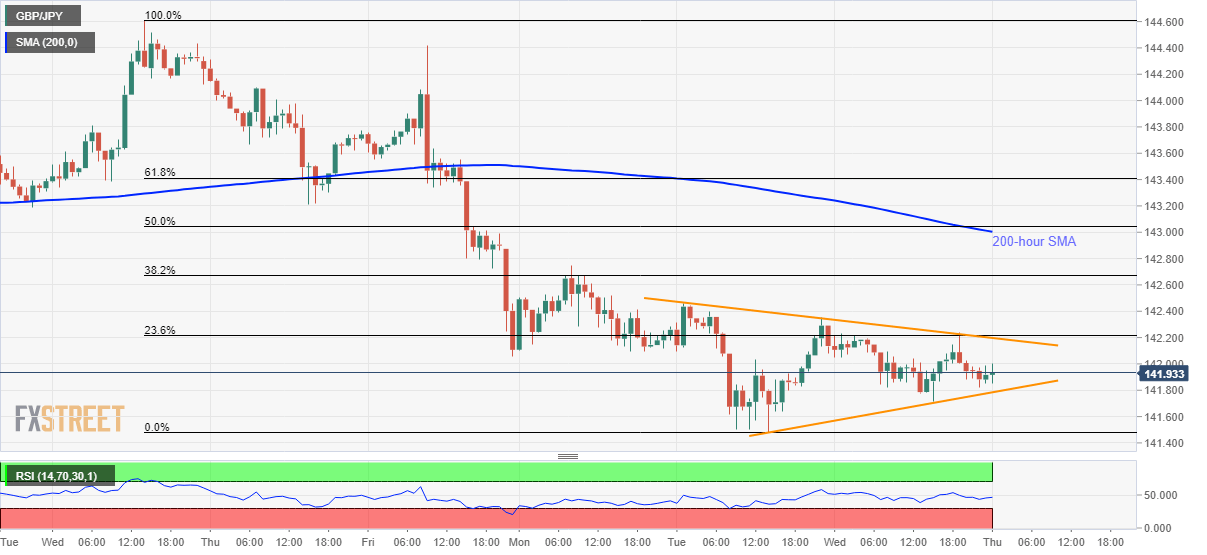
GBP/JPY aptly portrays the market’s inaction while flashing 141.90 as a quote during the Asian session on Thursday. The pair remains inside a neutral technical pattern while staying below 200-hour SMA.
Considering the pair’s sustained trading below the key SMA, sellers will look for fresh entry below the support line of the two-day-old symmetrical triangle, at 141.78 now. In doing so, the recent low near 141.48 could offer an intermediate halt before highlighting the monthly bottom surrounding 140.70.
Although the latest lower high formation indicates the bears’ inclination towards 140.00 below 140.70, multiple stops surrounding 139.30 will keep further declines limited.
Alternatively, an upside clearance of the formation resistance, near 142.20, can trigger fresh recovery towards a 200-hour SMA level of 143.00.
However, 61.8% Fibonacci retracement of its January 22-28 decline, at 143.40, followed by 144.00, will keep the buyers in check afterward.
GBP/JPY hourly chart
Trend: Sideways