WTI Price Analysis: Struggles around monthly falling trendline ahead of EIA inventories
- WTI rises to a three-day top following its bounce on Tuesday.
- Buyers look for a sustained break of resistance line.
- Sellers can target monthly bottom during the fresh declines.
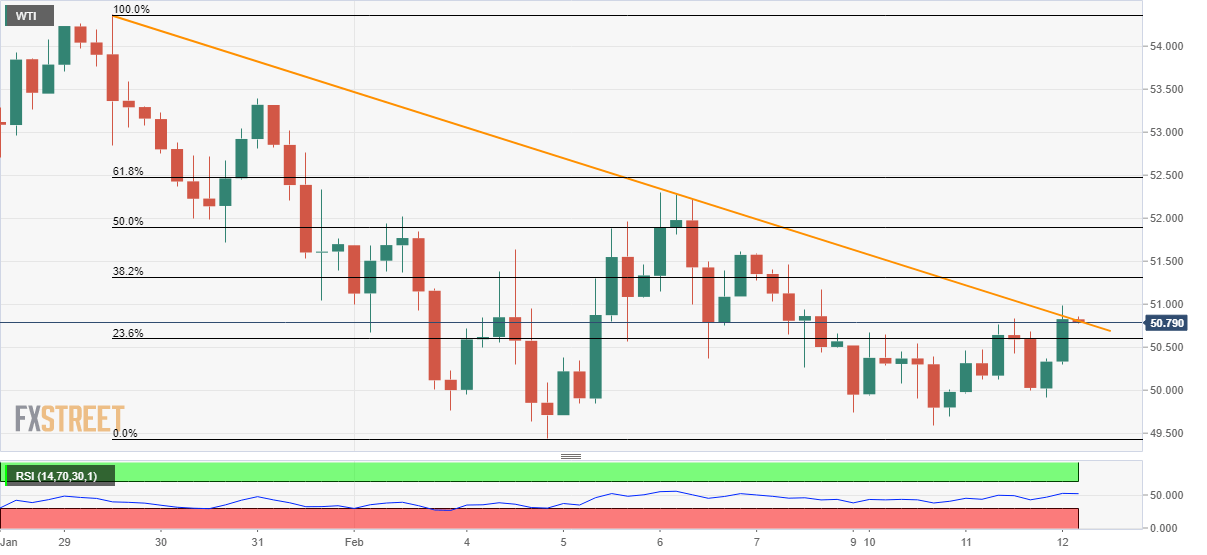
WTI trades 1.26% positive to $50.82 ahead of the European session on Wednesday. In doing so, the black gold nears a downward sloping trend line since January 29. However, buyers need a push to carry the latest bounce off multi-month low.
The weekly oil stockpile data from the Energy Information Administration (EIA) could offer that push to the traders if falling below 3.355M prior and 2.931M expected.
Following that, the energy benchmark could question the monthly top surrounding $52.30 and January 31 high close to $53.40. However, the quote’s further upside might have to conquer $54.40 to aim for November 2019 low near $54.85.
Alternatively, $50.00 and the recent low near $49.40 are likely supports that can please sellers ahead of highlighting late-2018 numbers surrounding $48.00.
WTI four-hour chart
Trend: Pullback expected
FXStreet Indonesian Site - new domain!
Access it at www.fxstreet-id.com