GBP/JPY Price Analysis: Rising wedge on H4 keeps sellers hopeful
- GBP/JPY struggles above 61.8% Fibonacci retracement inside a bearish chart pattern.
- 200-bar SMA adds to the upside barrier, the previous week’s low can offer intermediate halt after the pattern confirmation.
GBP/JPY remains inside the two-week-old rising wedge, currently down -0.12% around 133.70, on the four-hour (H4) chart during Tuesday’s Asian session.
However, sellers will seek a sustained downside break of 133.15 support for fresh entry. In doing so, the previous week’s low, also comprising 23.6% Fibonacci retracement of the early-month downside, around 127.60 could be on the radars as the immediate target.
During the pair’s further declines past-127.60, 126.00 and the monthly low near 124.00 will lure the bears.
Alternatively, an upside clearance of the formation resistance, at 135.40 now, will defy the bearish technical pattern and propel the GBP/JPY prices to a 200-bar SMA level of 136.40.
Should there be a clear run-up above 136.40, 137.00 and the monthly high close to 139.20 may offer intermediate halts to 140.00 mark.
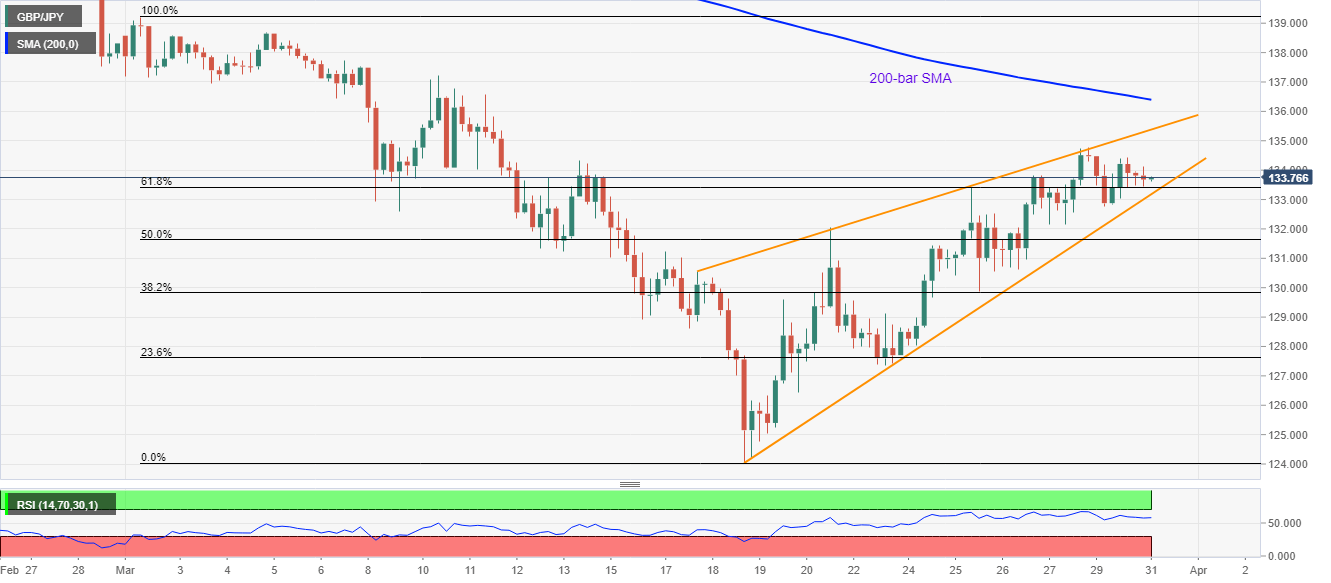
GBP/JPY four-hour chart
Trend: Pullback expected