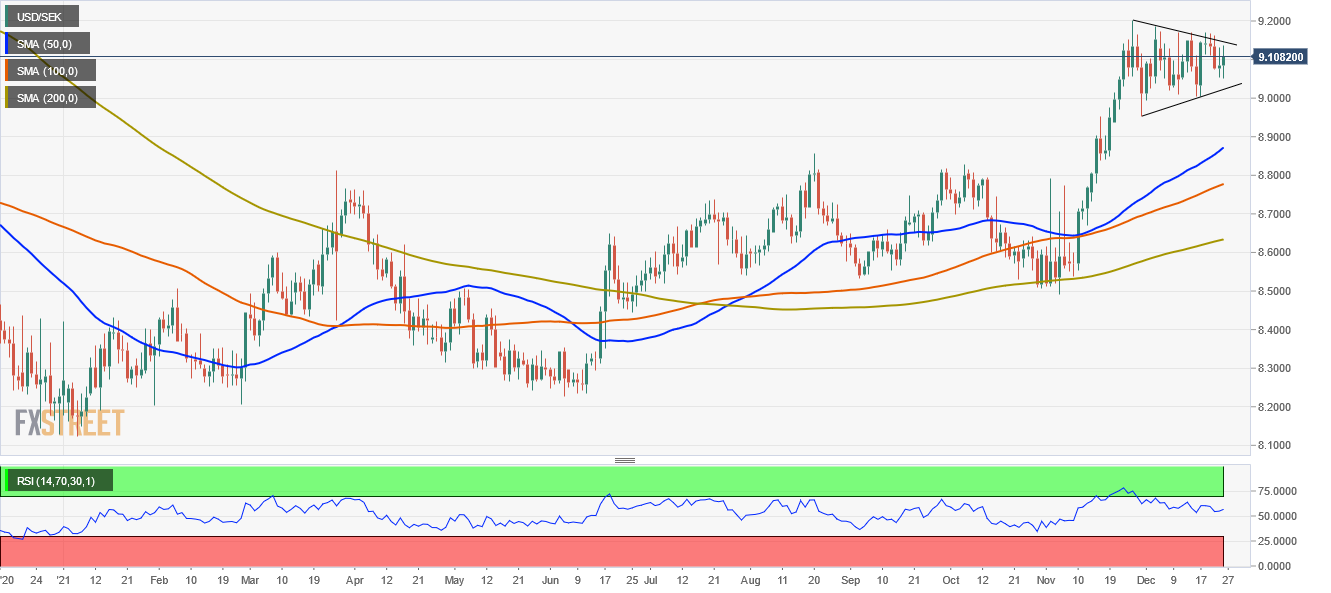
USD/SEK Price Analysis: Bullish-flag chart pattern in the daily chart targets 9.4000
- The USD/SEK advances some 0.36% during the day at press time.
- Thin market liquidity conditions have favored the greenback, which advances against most G8 currencies.
- USD/SEK Price Forecast: A textbook bullish-flag chart patterns, targets 9.4000.
The USD/SEK advances late in the European session, trading at 9.1256 at the time of writing. On Friday, Wall Street is closed in the US in observance of Christmas; US equity and money markets would re-open on Monday.
Thin market liquidity conditions keep the greenback in the right foot against most G8 majors, except for the British pound, gaining some 0.03%. In the equity markets, most European bourses that opened on Friday are in the green, except for the CAC 40, down some 0.28%.
A recap for US money markets, the US 10-year Treasury yield finished the week at 1.493%, while the US Dollar Index clung to the 96.00 figure, at 96.06, despite losing in the last three trading sessions ahead of Christmas eve.
USD/SEK Price Forecast: Technical outlook
During the Asian and European session, the USD/SEK dipped as low as 9.0500, pierced the December 22 daily low at 9.0535. However, as European traders got to their desks, the pair rallied up to the December 23 daily high around 9.1323, which capped the upward move, settling around current levels.
From the daily chart perspective, the USD/SEK depicts the formation of a “perfect” textbook bullish-flag chart pattern, formed through the month of December, that in the event of breaking around the 9.1500 figure would target 9.4000.
Nevertheless, it would find some hurdles on the way north. The first resistance would be the psychological 9.1500 figure. A breach of the latter would expose successive daily highs/resistance levels reached in December, like the December 20 daily high at 9.1704, followed by the December 3 high at 9.1864, and then the November 26 YTD high at 9.2026.
On the flip side, the first support would be 9.0500. A break below that level would expose the December 16 9.0043, followed by the figure at 9.000.

